advertisement


Turntable speed analysis part II

Phixphi, lot's of Ac controllers drop the voltage to make things run as smoothly as possible. Some do it because the phase lag isn't set accurately for the particular motor, just for a nominal value for that motor type. Others do it because it helps reduce the magnetic field intensity and therefore reduces cogging.

Personally I like the idea of adding viscous drag, this smooths the motor, reduces cogging due to the added load collapsing the field a little and you retain torque so stylus drag will never become an issue. Also because the drag created by the fluid is speed dependant the drag applied increases whenever speed does and decreases whenever speed do, so it auto-tracks any small changes in speed at the bearing, effectively under and over damping as required.

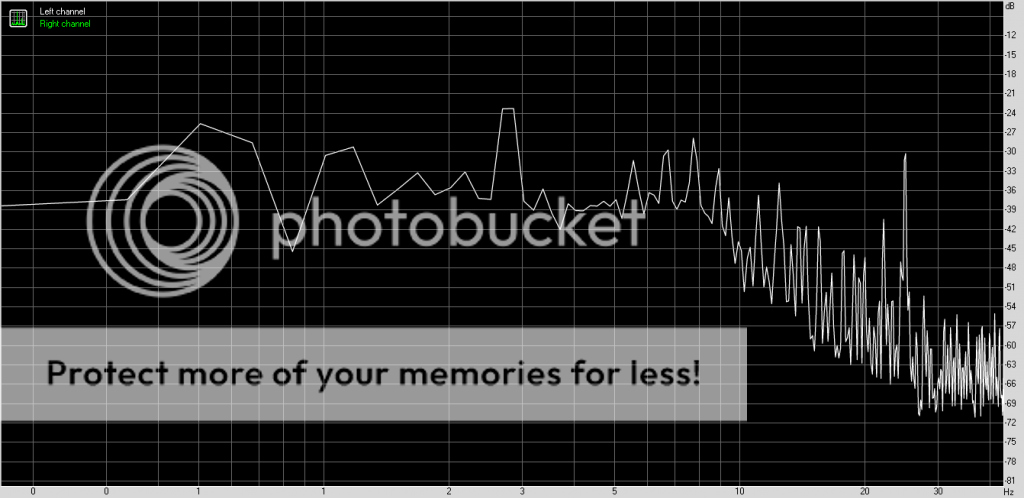
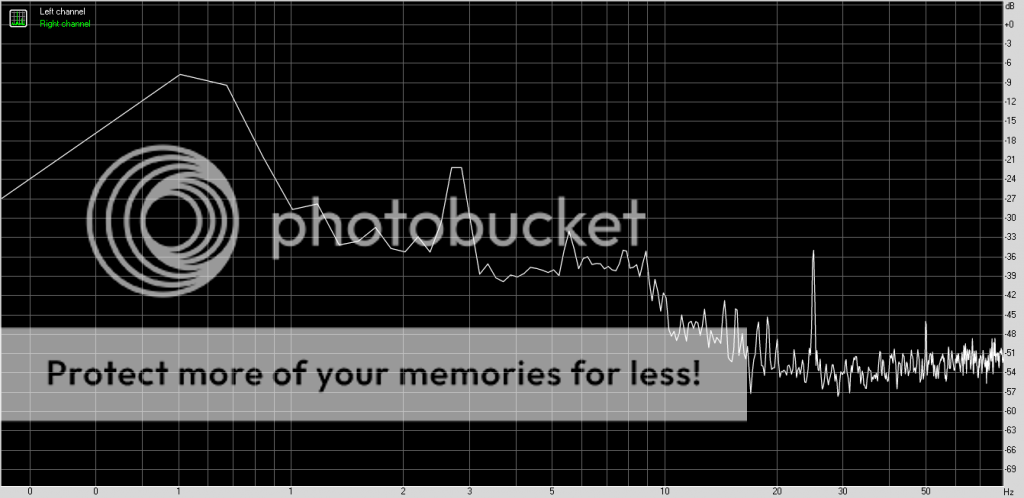
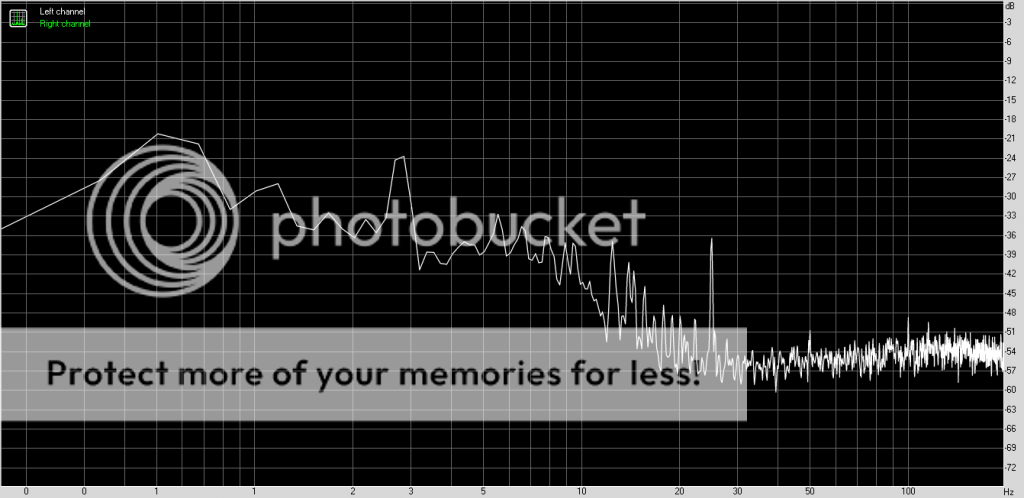
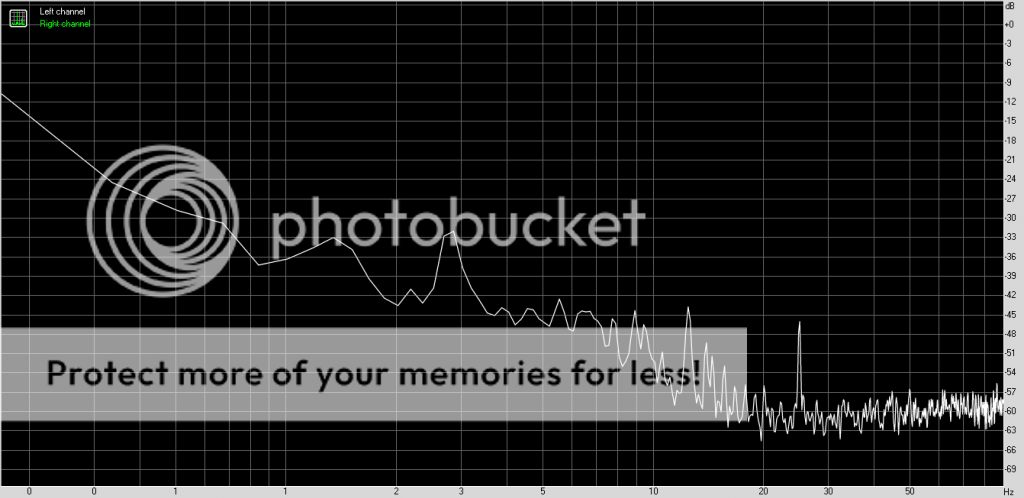
I tried simple capacitor shift, a Valhalla, a Lingo 1 and a Hercules, none of them sounded as good or measured as smoothly as a simple Geddon clone with 'sticky' bearing oil.
 
1) FR7f+3012R, CONSOLE
Spectrum:
phix418spectrum_zps8e35a9c6.png

Ed, thank you! Are your software parameters the same as in the
plots below?

2) post #396 (spectrum of my old standard from 334, TSD15SPH+EMT929, CONSOLE):
v2...ps02f02753.png


and

3) post #377 (spectrum of my previous standard from 360, TSD15SPH+EMT929, NO CONSOLE, 930 resting on it's frame)
v2...ps8ccf4d7a.png


If so then this shows the influence of the console on W&F.
The plots 1) & 2) are pretty consistent, modulo more resolving arm+cart in the former. Plots 2) & 3) were taken with all the same variables expect from the console (ok plot 2) hot Barcelona, plot 3) cold Gdansk). Wow!(and flutter), this sort of influence of the console I could not imagine. So the 930's drive mechanism generates quite some internal vibrations, eh? Those old EMT farts knew what they were sayng the deck needs the console (but they had way too much Weizenbier when they drew the consloe cut outs in the EMT manual...)

Sq--points taken, thank you. The real 3 phase controller + eventually lower volts and/or increased drag will be my attack on the 25Hz peak :)

PS The increased background in 1) between 5-10Hz wrt 2) is probably due to the fact that 1) is a suspended wooden floor (current situation), while 2) was a concrete floor + parquet. I can easily see this 5-10Hz energy when dropping the cart down on the non-rotating vinyl surface (and standing still) with my simple Audiotester FFT analyzer. This is probably structural vibration of the building, suspended floor, etc (no heavy traffic nearby in either situation)

PSS Paul, Ed your tools are simply FANTASTIC!! Chapeau!
 
Ok, having sorted the standard and the influence of the console, once again the teflon washers (deck is always in the console, FR7f+3012R=same conditions as in #418). The below files should be compared, under the same processing, against that of #418 to see the influence of the teflon in various places:

1) Teflon washer below the idler (between the idler's bottom and the fiber washer with the pin):

http://www.mediafire.com/?urdwaqzxc5fawk8

2) As above+teflon on top of the idler, between the idler surface and the top fiber wahser:

http://www.mediafire.com/?0918g5zn8s91v82

3) As in 2) + teflon between the top fiber washer and the locking washer:

http://www.mediafire.com/?4t1o8qwp4mbdylm

The reason behind putting the washers on top, esp. right under the locking washer is that the idler goes up when rotating and the top fiber washer, rotating with the idler, works against the steel locking washer. I saw the latter mometarily stopping, then rotating again, then stopping, etc.

Sorry for being such a pesadito, I hope we all learn something from this.
...and I owe Paul&Ed a bottle of good vodka (each :))
 
Thanks Ed!Highly confusing...Once the washer helps, then it makes worse...grrr
I have cut smaller holes in the washers this time, perhaps they slightly work aginst the axis?
Will correct the washers and take the signals again, if you don't mind.
 
In this case im not sure its the washers. 2 and 3 lower the 2.55hz by the same amount, around 3db. In this case what is coming through is the motor noise at 25hz, It has increased by 5db. I am unsure if this is down to the washers.
 
For some fun. I ran a 0.1% fast and a 0.3% fast signal through the demodulator. I converted the resulting files through sox and opened in openoffice calc (excel)

I then found the average level of both files to make sure the process I'm using is linear.

The results were good, so I took the 3rd file from post 423, weighted it similar to DIN specs, a 6db high and low pass centred at 4hz, converted in sox opened in calc.

I then found the maximum, minimum and rms values, and compared with my previous test signals to get some numbers.

Peak deviation: -0.167% +0.171%
RMS: 0.048%

Obviously take these numbers with a pinch of salt. The main thing I am not sure on is if wow and flutter percentage is if the percentage is based on the speed deviation percentage, or if its based on the modulation signal percentage.
 
In this case im not sure its the washers. 2 and 3 lower the 2.55hz by the same amount, around 3db. In this case what is coming through is the motor noise at 25hz, It has increased by 5db. I am unsure if this is down to the washers.

Indeed, but all the rest jumped up: peaks at 5.5, 6.5, 7.5Hz.
The motor was not warmed up like in the #418 standard (few mins vs. ~1h), perhaps that's why
it was vibrating more?
 
Peak deviation: -0.167% +0.171%

Insultingly high! The deck was under service 2 yrs ago and supposedly peaked at 0.07% once per rev., measured most probably on EMT424 with a special measuring disc with a brass insert.

Obviously take these numbers with a pinch of salt. The main thing I am not sure on is if wow and flutter percentage is if the percentage is based on the speed deviation percentage, or if its based on the modulation signal percentage.

http://rover.ebay.com/rover/1/710-5...0001&campid=5338728743&icep_item=320678457110

This is EMT422, right meter says "FM Peak Value". Does it help?
 
This site contains affiliate links for which pink fish media may be compensated.
Insultingly high! The deck was under service 2 yrs ago and supposedly peaked at 0.07% once per rev., measured most probably on EMT424 with a special measuring disc with a brass insert.


http://rover.ebay.com/rover/1/710-5...0001&campid=5338728743&icep_item=320678457110

This is EMT422, right meter says "FM Peak Value". Does it help?

No it doesn't help much, I have been reading a few wow and flutter meter manuals and a lot of the specifications are quite vague. I have found a few response curves, I will attempt to replicate them.

In this case its heavily dominated by the high pass of the eccentricity, and I'm unsure quite what filters to apply to match the standard.

My method of checking the maximum value also looks at 1 million samples, right down to the 44100 level, it is probably more sensitive than a peak meter, perhaps, and the odd spurious peak will have an effect.

I think the standard deviation and rms values are more interesting, both of which sit at 0.048%.
 
This site contains affiliate links for which pink fish media may be compensated.
For example. Looking at the file with only a 200hz low pass filter, not accounting for eccentricity we get a peak 0.44% speed deviation.

With some quick maths, That would be a record off centre by 0.45mm, that half a mm.

The original spec calls for the test lp to be centred within 0.3mm.

Perhaps Nakamichi were on the right track with a self centring turntable.
 
For example. Looking at the file with only a 200hz low pass filter, not accounting for eccentricity we get a peak 0.44% speed deviation.

Shouldn't you substract from that the deviation with the eccentricity high pass filter on and then calculate?
Or better yet use only the 0.55Hz peak to calculate it (neglecting higer order terms).

I have also a presentational idea re the polars: to plot them with the best fitted circle. it would make it easier to assess at a glance
the deviation...before diving into the hell of the full spectrum.

Right, the difference in the numbers, 0.44% and 0.17% was simply the high pass. I have been using a simple 12db roll off below 1hz. It looks like the spec is a 6db roll off at 0.3hz, and then a 6db roll off at 4hz on top for weighting. Similarly on the low pass its a 15db roll off above 200hz, then a 6db roll off above 4hz on top for weighting.

Even then, if the lp is off centre more than the specified 0.3mm the result will not line up with the DIN spec.

As I also mentioned, the DIN spec is based on a peak, but how small a peak, how instantaneous is the measurement on the peak meters. While the RMS values end up lower, they seem to me to be a more useful measure in this instance, and it was used by JIS.

In theory, sinusoidal, the RMS will be 0.707 of the peak value. Assuming the peak meter on the din machines isn't that instant, we could guess the peak from the RMS value of 0.048%, we end up around 0.067%, inline with the 0.07% spec of the machine in the manual, and that measured when it was serviced.

I plan on adding the 0.1% circles on later plots.
 
I have been using a simple 12db roll off below 1hz.

Hmmm...why not a steeper one to affect the rest of the spectrum less? Besides, nitpicking a bit,
it should be 1.11Hz to cut both the fundamental and the 2nd harm. :)


I plan on adding the 0.1% circles on later plots.

What is it? What I meant was to try to fit the best circle
to the actual data. There were programms for that I remember from my studies, Origin Lab was it?

Ed, looking at your latest spectrogramms, I keep wondering why they are so jagged past 10Hz? Is it real, comming from the machine (e.g. acoustical noises: the felt break, white noise of the tube phono, etc) or is it a software artefact?
 
Oh sorry, you mean a best fit line though the data itself. I will look into it.

I think its hard to say what those jagged points are, I don't think it is particularly useful either. What we want to see is large obvious peaks above the background. Particularly when we can relate it to a fundamental of the drive system, like the 25hz from the motor.

The only way those peaks would be interesting to me is if we saw the drop from a modification.
 
Ed, if you are still up to continue your heroic work,
here is something more to chew on:

1h+ warmup, teflon washers with 0.5mm larger cutout @4.5mm

0') standard again :) FR7f in 3012 picks NO tik-tik-tik sound, unlike London Jubilee few months ago..hmmm
http://www.mediafire.com/?d6z3q98axenvf41

1') teflon below the idler only
http://www.mediafire.com/?bd801db2cr3z901

3') teflon below+both teflon on top
http://www.mediafire.com/?kotjko6eye3eafk

4) both teflons on top, no teflon below
http://www.mediafire.com/?17avom6dzohabhs

Many thanks!
 
I compared motor noise in the CONSOLE

(#418) Actual standard
Spectrum:
phix418spectrum_zps8e35a9c6.png
[/QUOTE]

Console + teflon:

Spectrums:
1:
phix423-1spectrum_zps0e5a289d.png

2:
phix423-2spectrum_zps8135d2cb.png

3:
phix423-3spectrum_zps26ff0049.png

(#334) Old standard
Spectrum from 334:
334spectrum_zps02f02753.png


To that with NO CONSOLE:

(#396) Spectrum from the teflon washer:
teflonspectrum_zps64254c9e.png
[/QUOTE]

(#377) 0-50hz Standard
phix-standard0-50_zps8ccf4d7a.png


0-50hz Teflon
phix-teflon0-50_zpsbdb5e3ca.png


It looks like the console interacts with the motor noise in a non-trivial way:
it damps the 12.5Hz (fundamental?) peak, but hugely (up to 8db!) amplifies
the 25Hz peak. This has to do with the console material (6cm plywood block
on top of a sand filled steel frame) and the interface deck-console (the deck
supported in the corners mostly via the plastic s...t, as per original EMT idea).
Most probably that 25Hz is close to the resonant point of the console (plywood?).

EDIT I'm however unsure if all the plots are directly comparable due to
different error amplifications used, am I right Ed?
 
Most of those should be comparable. I didn't start posting the spectrums until I had the demodulation fairly well worked out.

What test lp are you using? Using a set of filters very close to that used in the DIN weighing I get this polar:
phix436weightedpolar_zps97ba54e1.jpg


Which looks rather a lot like the polar from my Yamaha:
yamahafiltered_zps6cbb3834.jpg
 
I did a bit of looking into it, the Analogue productions test lp was cut on a Neumann VMS 80 at sterling sound.

On here:http://sterling-sound.com/mastering/vinyl/#3

And I quote "The VMS 80 computer divides each rotation of the platter into sixteen increments"

16 increments works out to be 8.88hz, visible on most the spectrums, particularly the Yamahas. It also showed up on my DIY turntable plot.
 
Great job Ed!

I did a bit of looking into it, the Analogue productions test lp was cut on a Neumann VMS 80 at sterling sound.

On here:http://sterling-sound.com/mastering/vinyl/#3

And I quote "The VMS 80 computer divides each rotation of the platter into sixteen increments"

...and this was a shitty idea. I thought I'm getting the 3rd order idler beat (3x2.72=8.16Hz). This is also why I more & more concentrate on spectra rather than polars, however briliant & catchy the latter idea is,--more insight.

Ed, if you are so kind to process my last files, would it be possible to plot them (esp. the spectra) on the same plot with different colours? Would be easier to spot the influence of the washers.


advertisement


Back
Top