Werner
pfm Member
It is whatever AudioTester uses by default, probably something log-like for efficiency. Since source and display are in sync (with a three-header) this does not matter. Compensation for the head-to-head latency, 150 points per graph, perhaps 2 minutes or so. Characterising a tape (responses, MOL, SOL, noise, relative bias and sensitivity) takes me 20-30 minutes.
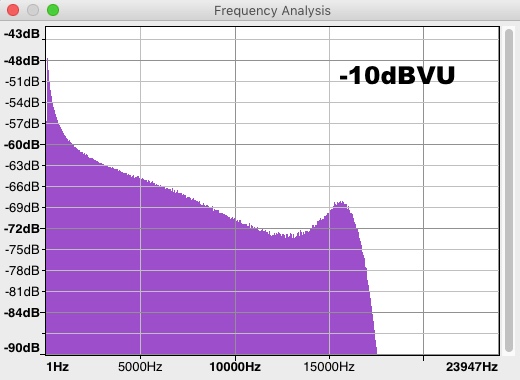
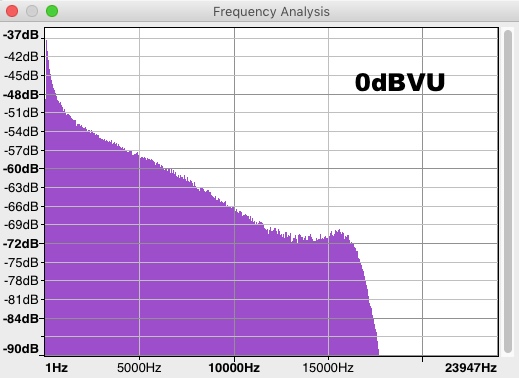
Cassette decks are specified at -20dB relative to either Dolby level or DIN/IEC-zero (these are just 1.2dB apart, not much difference), i.e. the lower graph on my picture. The other levels are added because they can be interesting. Some magazines in the past tested at -20 and 0dB. When I started this I adopted Alex Nikitin's (ex-Creek, now A.N.T.Audio) display format. This way at least two people are showing graphs that can be compared with some validity.
Cassette decks are specified at -20dB relative to either Dolby level or DIN/IEC-zero (these are just 1.2dB apart, not much difference), i.e. the lower graph on my picture. The other levels are added because they can be interesting. Some magazines in the past tested at -20 and 0dB. When I started this I adopted Alex Nikitin's (ex-Creek, now A.N.T.Audio) display format. This way at least two people are showing graphs that can be compared with some validity.
")