
You are using an out of date browser. It may not display this or other websites correctly.
You should upgrade or use an alternative browser.
You should upgrade or use an alternative browser.
Turntable speed analysis part II
- Thread starter flavio81
- Start date
edd9000
pfm Member
I used your latest files as a reference phix to test my current turntable.
Here was your standard:

Teflon washer no foil:

Teflon washer with foil:

And finally my Bix, which uses a premotec dc motor with a basic speed controller:

I need to go back through some earlier files to make sure its working, spectrum lab has changed the fm demodulator behavior.
Here was your standard:
Teflon washer no foil:
Teflon washer with foil:
And finally my Bix, which uses a premotec dc motor with a basic speed controller:
I need to go back through some earlier files to make sure its working, spectrum lab has changed the fm demodulator behavior.
edd9000
pfm Member
Isn't the Premotec is usually an AC Motor ?
That last result looks quite remarkable, what test record are you using?
The picture seems to be having issues on photobucket, I will fix it when I have a chance.
It is a small brushed DC motor, when I get the chance I will get the part number off it. The test record is a hifi sound test record, HFS 74. Which is 3000hz not 3150, but I adjusted for that in the demodulation and plot. The result was so smooth when I first went through the process I assumed something was wrong, which is what led me to plot phix's results using the same scale.
I hope to verify them better. When I get the chance I will upload the file and Paul can plot it.
phixphi
pfm Member
Edd, thank you!
Wow, what a difference! The idler must have been working against the notorious
fiber washer (the one with the pin), producing the fast tik-tik-tik sound I could hear with
a more advanced arm-cart than the stock EMT.
Edd, do you also have the demodulated spectra? Would be interesting to see how much is the 2.72Hz peak attenauted by the teflon washer.
BTW, the difference between my files 1) and 2) lies not in any foil--both 1) and 2) were taken with the same teflon foil washer in place. The only difference is a nearby fridge beeing switched on (track 1) and off (2)...") ) The deck was out of its console so it was sensitive to all vibrations and I did not remember if when taking the standard 3) the fridge was on or off ...but the difference is so obvious that it doesn't matter.
) The deck was out of its console so it was sensitive to all vibrations and I did not remember if when taking the standard 3) the fridge was on or off ...but the difference is so obvious that it doesn't matter.
Your file looks very smooth=absence of flutter? But the shape is more oval, could it be the test LP eccentricity?
Good job guys and thanks lencoheaven Dimitri for the tip!
PS Edd, I presume your scale is different than Paul's as my standard polar plot did not look that ugly (red trace):
http://www.pinkfishmedia.net/forum/showpost.php?p=1788378&postcount=341
or something else has happened?
Wow, what a difference! The idler must have been working against the notorious
fiber washer (the one with the pin), producing the fast tik-tik-tik sound I could hear with
a more advanced arm-cart than the stock EMT.
Edd, do you also have the demodulated spectra? Would be interesting to see how much is the 2.72Hz peak attenauted by the teflon washer.
BTW, the difference between my files 1) and 2) lies not in any foil--both 1) and 2) were taken with the same teflon foil washer in place. The only difference is a nearby fridge beeing switched on (track 1) and off (2)...
) The deck was out of its console so it was sensitive to all vibrations and I did not remember if when taking the standard 3) the fridge was on or off ...but the difference is so obvious that it doesn't matter.Your file looks very smooth=absence of flutter? But the shape is more oval, could it be the test LP eccentricity?
Good job guys and thanks lencoheaven Dimitri for the tip!
PS Edd, I presume your scale is different than Paul's as my standard polar plot did not look that ugly (red trace):
http://www.pinkfishmedia.net/forum/showpost.php?p=1788378&postcount=341
or something else has happened?
edd9000
pfm Member
I will have a look at trying to post the spectrum. That is something I have not managed as well as Paul.
The scale wont be the same. I use spectrum lab to demodulate the signal. Demodulation makes a waveform from the deviation from the frequency. If you set the centre to 3150, as the speed goes up, say to 3160 that gives a positive peak, as it goes under you get a negative peak. How big those resulting peaks are in the plot depends on the gain of the demodulator in spectrum lab, and of course the scale in gnuplot. I just try to be consistent, this isn't about absolute numbers, its about better or worse.
On the bix, I think its at the point where I'm not sure, I could be eccentricity, It could be the recording on the lp itself, it could be minor speed variations from the bearing or belt. I haven't had it set up long.
phixphi
pfm Member
The scale wont be the same. I use spectrum lab to demodulate the signal. Demodulation makes a waveform from the deviation from the frequency. If you set the centre to 3150, as the speed goes up, say to 3160 that gives a positive peak, as it goes under you get a negative peak. How big those resulting peaks are in the plot depends on the gain of the demodulator in spectrum lab, and of course the scale in gnuplot. I just try to be consistent, this isn't about absolute numbers, its about better or worse.
This is how I understand it too. Your scale seems to be more revealing
and less forgiving
) Would be nice to compare it to Paul's plots. On the bix, I think its at the point where I'm not sure, I could be eccentricity, It could be the recording on the lp itself, it could be minor speed variations from the bearing or belt. I haven't had it set up long.
The spectrum plot should give a clue. When you attempt it, please try to make it in two versions: a larger picture up to, say, 100Hz and a more specific one up to 25Hz. I use a tube phono, so my flutter could be partly due to tubes' thermal noise.
BTW, is this the soft you're using:
http://www.qsl.net/dl4yhf/spectra1.html ?
edd9000
pfm Member
That's the one, I have a full guide on my blog http://teribil-audio.com/2012/06/software-based-wow-and-flutter-analysis/
What seems to have changed is the gain output from the demodulator. I used to have to set to -25db, but in the latest version im using +55.
If you have an IOS or Android device, platter speed is well worth a look too. The Idler cogging was clearly visible on its plot when I played back the file through my speakers.
phixphi
pfm Member
Great Edd!! Thank you for your effort of putting all it up in the web!
Will try to build my onw WF analysis along your lines.
I have Android device but...I don't have speakers, I listen on headphones.
If I couls ask you a favour, could you pls test the file #1 from here:
http://www.pinkfishmedia.net/forum/showpost.php?p=1781539&postcount=334
I'm wondering if the idler beat is the same as in the file you've analyzed.
Thanks!
phi


edd9000
pfm Member
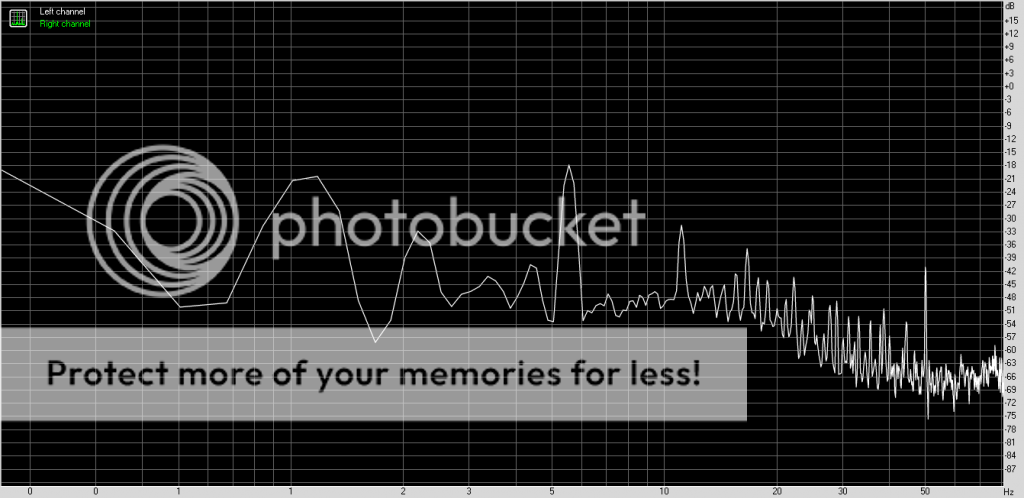
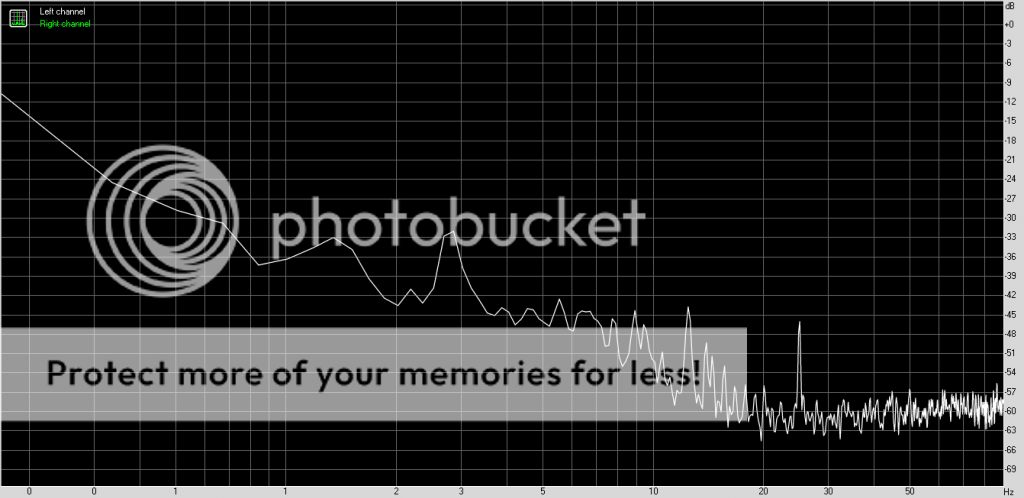
And my bix, bare in mind the verticle scales, I had to adjust the verticle scale to fit the plots on.
0-10hz

0-50hz

All of these were done on the raw unfiltered output from spectrum lab. I only trimmed the start and end of the files. On the teflon samples from phix, they were at 22100 so had to be resampled to 44100, which should have little effect.
0-10hz
0-50hz
All of these were done on the raw unfiltered output from spectrum lab. I only trimmed the start and end of the files. On the teflon samples from phix, they were at 22100 so had to be resampled to 44100, which should have little effect.
edd9000
pfm Member
Ed the eccentricity looks to be at multiples of platter revolution . I'd say its record eccentricity rather then related to deck mechanics.
While its playing I cant see the arm wandering back and forth. But it could easily be the pressing or the cutting, it is old, and could be warped. But for £7 on ebay I figured a test record was better than no record.
phixphi
pfm Member
Thanks Ed! I'm quite puzzled.
This 5.5Hz peak (2nd harm. of the idler fundamental) is a novum at that magnitude (higher than 2.72). The washer did remove it, leaving 2.72Hz untouched--this is probably idler surface irregularity (a bump?). It also removed some higher order components,leaving clearly the first two motor related peaks: fundamental at 12.5Hz and it's 2nd harm...but I'm a bit perplexed.
The standard picture is uglier than it used to be. There are 2 factors: the deck has been mover recently but with all the care: platter aside, idle protected etc; the deck was nacked, no console, resting on it's frame. I don't rememeber how it was last time (post #334) but I'm 99% sure it was in the console. Could it be that the console damps some of the idler related vibration (it doesn't reach the arm via the chassis)? I hope to make your soft procedures work and will check it myself (SoX won't run ok under my win7 :-((