advertisement


So that's the climate f****d then

Great chart on GHG, Joe. Where does all the agricultural NOx release come from? Is it from fertilizers? Do you know if the chart is in CO2 equivalent tonnes?

TBH I get a bit discouraged looking at the chart. To take an example, if we were to eliminate HFCs completely in all industrial, retail and domestic applications the impact would be less than 1%, and reduced by any increased energy consumption due to using alternative products. Eliminating all air travel: 1.6% if you eliminate all those journeys, less if people still travel by rail or car.
 
PsB,

The NOx emissions from agriculture mostly stem from soil that's been fertilized to grow crops and livestock manure and to a lesser extent run-off and leaching of fertilizer. I can't remember the source, but I recall reading a while ago that more nitrogen is fixed industrially for fertilizers than is fixed by all natural processes. It's actually one of many signs that we're living in the Anthropocene — a species of ape is fixing more nitrogen than micro-organisms and legumes and lightning and...

According to the World Resources Institute, "All calculations are based on CO2 equivalents, using 100-year global warming potentials from the IPCC (1996), based on a total global estimate of
41,755 MtCO2 equivalent."

Joe

Correct, we're lucky if 60% of N fertiliser is retained in the growing crop. There is a significant loss soon after application in some instances and medium term storage in the ground pending significant rainfall.

Bear in mind that this nitrogen is still fixed by something similar to the Haber-Bosch process; since this involves high temperature and pressure there is a large associated production of CO2 as well.

If everyone would accept tough little flatbreads instead of a nice airy conventional bread we could eliminate about 30% of the nitrogen fertiliser use on bread making wheat.
 
To be fair, many countries either eat little bread - China, SE Asian nations etc - or eat flatbread - India, Pakistan, many ME and African countries - so I'm guessing the impact is comparatively tiny.
 
Looking at GHG chart on the previous page I'm left wondering if the single best thing we could do is plant trees as though our lives depended on them.

Joe
 
DBVbBKlUMAAZV4C.jpg:large


Joe

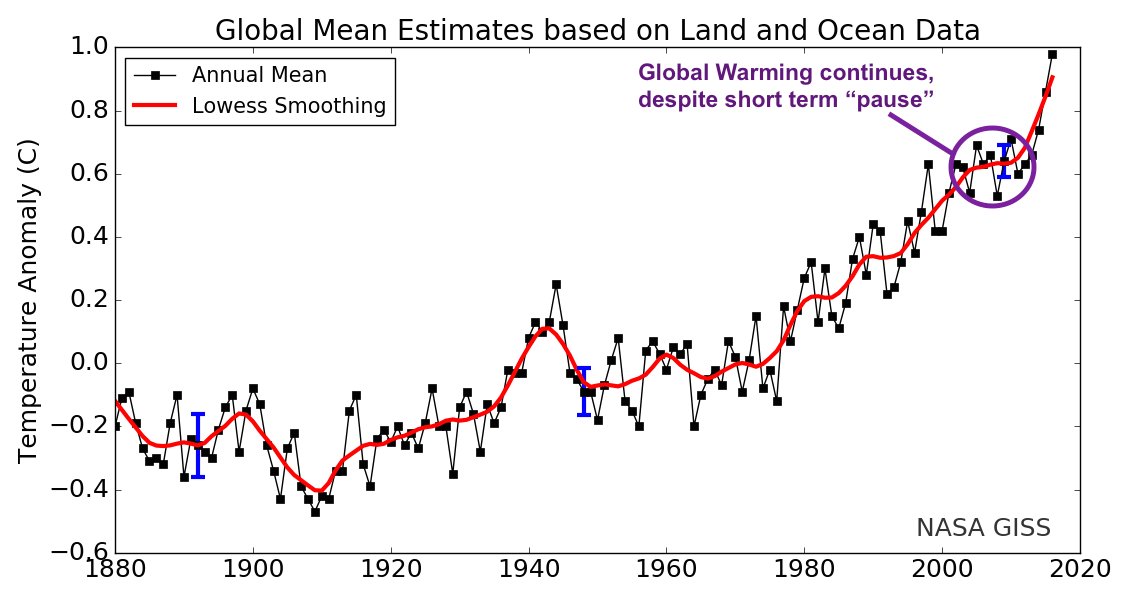
I think this data needs to be put into context. In 140 years there is an observed change of +1.4C (trough to peak). What would it show if we had 10,000 years of data or 100 Million years of data? Life has existed on this planet for a long time with a climate that has evolved substantially. Yet we want to make predictions of disaster from such a small data set?
 
I think this data needs to be put into context. In 140 years there is an observed change of +1.4C (trough to peak). What would it show if we had 10,000 years of data or 100 Million years of data? Life has existed on this planet for a long time with a climate that has evolved substantially. Yet we want to make predictions of disaster from such a small data set?
I haven't looked into the evidence in detail but I have a feeling climatologists might have already considered that argument.
 
Tim,

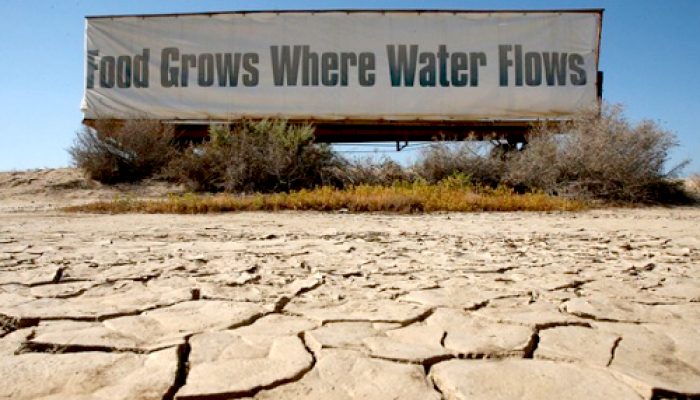
Where do you think the irrigation water is coming from? Often it's from groundwater and it's being depleted faster than it's being recharged, all over the world.

droughtfi-700x400.jpg


Joe

But the Earth's water cycle effectively is a closed system, the water cannot "go" anywhere because it cannot escape the pull of gravity. Certainly it can be redistributed, but it won't be lost.
 
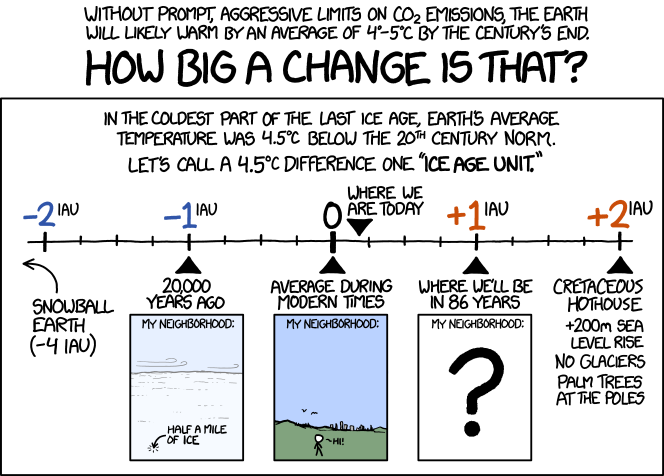
And a longer timeline.

earth_temperature_timeline.png


Joe

Which reinforces my point, even though the historical temperature data is implied, rather than directly observed, as there were no scientific records kept before about 1880. I think it is very important (speaking as a scientist) to distinguish between observed data and prediction. The former you cannot really argue with, unless you can provide more and better data. The latter however, forward looking predictions are, in my view, so error prone that they are difficult to take seriously. If you look at the dashed line, showing best case, optimistic and current path and were to plot realistic error bars, they would be enormous! If you just wind the clock back 20 years and plot the "current path", which clearly you are being encouraged to believe is the most likely, it would look nothing like it does now.
 
Which reinforces my point, even though the historical temperature data is implied, rather than directly observed, as there were no scientific records kept before about 1880. I think it is very important (speaking as a scientist) to distinguish between observed data and prediction. The former you cannot really argue with, unless you can provide more and better data. The latter however, forward looking predictions are, in my view, so error prone that they are difficult to take seriously. If you look at the dashed line, showing best case, optimistic and current path and were to plot realistic error bars, they would be enormous! If you just wind the clock back 20 years and plot the "current path", which clearly you are being encouraged to believe is the most likely, it would look nothing like it does now.
I don't follow your last point. The trajectory, as seen at a point in time 20 years ago, looks very similar to the current trajectory. It's hard to gauge precisely but it looks to me like you would have to go back at least 40 years to perceive a different trend, and even that would be upwards.

In any case, the data isn't the be all and end all. It exists within a comprehensive theoretical framework that includes our knowledge of Chemistry, Physics and our (admittedly less well-developed) understanding of complex systems. My understanding is that the data hangs together within that broader picture and that this gives further credence to the predictions.

What's your area of science John, if you don't mind me asking? I'm Physics (PhD student).
 
But the Earth's water cycle effectively is a closed system, the water cannot "go" anywhere because it cannot escape the pull of gravity. Certainly it can be redistributed, but it won't be lost.
It is being moved from underground in arid areas into the sea. The result is a small additional sea level rise, shortages in dry regions and coastal areas sea water replaces the ground water, making it unusable
 
John,

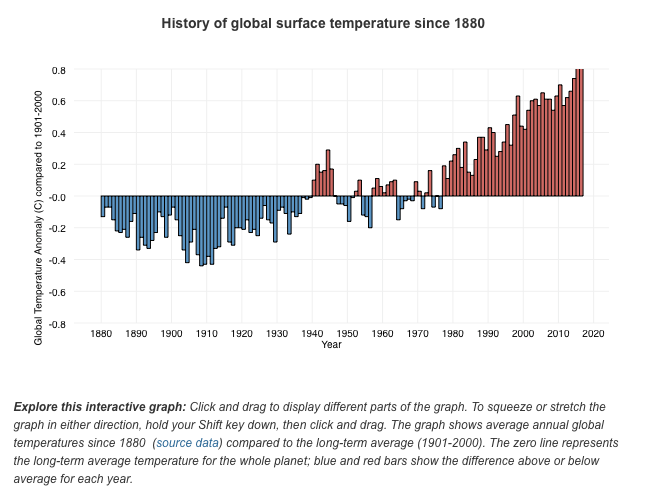
The global temperature record from 1880 until the present is based on direct measurement. The closer we get to the present time the greater the accuracy and precision, as the record is based not only on multiple surface measurements but also satellite data. The temperature record before 1880 is reconstructed from a variety of sources. Not perfect, but it's hardly a guess.

The trend in the global temperate data is clear and it's upward, as is the atmospheric concentration of CO2, a noncondensing greenhouse gas.

Joe
 
John,

But the Earth's water cycle effectively is a closed system, the water cannot "go" anywhere because it cannot escape the pull of gravity.
No, not lost, but water needs to be where plants grow.

Joe
 
I don't follow your last point. The trajectory, as seen at a point in time 20 years ago, looks very similar to the current trajectory. It's hard to gauge precisely but it looks to me like you would have to go back at least 40 years to perceive a different trend, and even that would be upwards.

The current prediction seems quite extreme based on a very recent upward trend which may or may nor be sustained. In the context of a climate that has varied substantially over millions of years, yet been stable enough to support life, I would want to see more data points.

In any case, the data isn't the be all and end all. It exists within a comprehensive theoretical framework that includes our knowledge of Chemistry, Physics and our (admittedly less well-developed) understanding of complex systems. My understanding is that the data hangs together within that broader picture and that this gives further credence to the predictions.

It is the lack of understanding of complex systems that is the problem and predictions are therefore likely to have substantial error. I would want to see some back testing as more data comes in to assess the quality of the model calibration. As a very smart person once said to me, "I agree with your data, but disagree with your conclusions." It is quite reasonable therefore, for a well educated scientist to disagree with the predictions of climate disaster. And I do, mostly.

What's your area of science John, if you don't mind me asking? I'm Physics (PhD student).

I have a PhD in Quantum Physics. Over 20 years ago, I developed a new technique which is still used in experiments to study collision theory between electrons, photons and gas atoms and molecules. It is actually quite relevant to the discussion particularly the behaviour of the upper atmosphere, though it doesn't give me any direct experience of climate modelling which I understand only in broad terms.
 
The current prediction seems quite extreme based on a very recent upward trend which may or may nor be sustained. In the context of a climate that has varied substantially over millions of years, yet been stable enough to support life, I would want to see more data points.
Because it seems to be about right and the consequences are critical - we are talking about India and a few other countries being uninhabitable in the near future. Fancy 2 billion refugees on your doorstep
 
I note that Joe has posted an image on the previous page that purports to display a collection of temperature histories. At least one doesn't match the source data.

I'm guessing he's not too bothered..

Paul
 
Some facts from the National Oceanic and Atmospheric Administration

  • Global surface temperature in 2016 was the warmest since official records began in 1880. It was the third year in a row to set a new heat record, and the fifth time the record has been broken since the start of the 21st century.

PxZVhmT.png


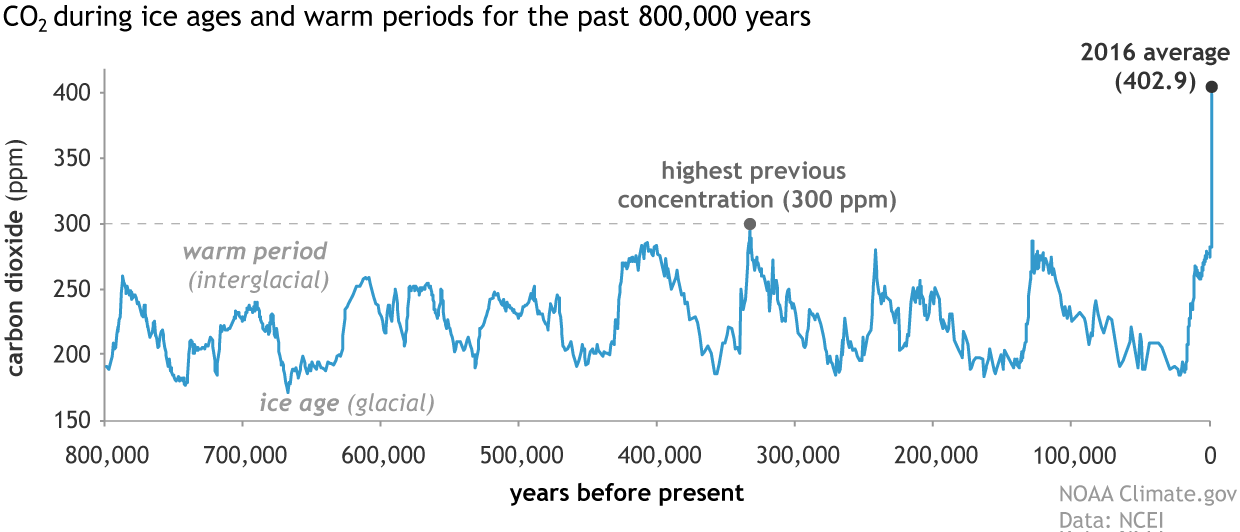
  • By burning fossil fuels for energy, human activities have increased the concentration of carbon dioxide in the atmosphere by more than 40% since the Industrial Revolution, causing global warming and making the pH of the ocean more acidic.

paleo_CO2_2016_1240.gif


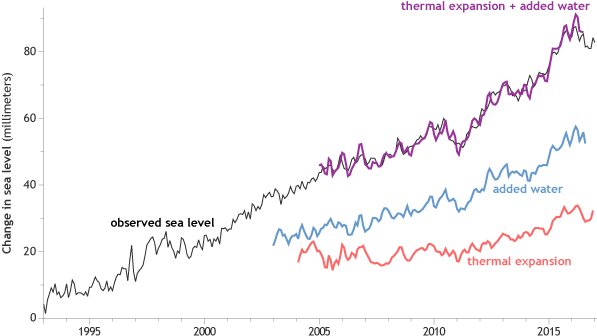
  • Sea level hit a record high in 2016. Independent estimates show that waters are rising due to meltwater from glaciers and ice sheets (blue line) plus thermal expansion (red line) of the ocean water as it warms (red line).

StateoftheClimate_2016_SeaLevels_graph_597x336.png


Joe


advertisement


Back
Top